Objective
To analyze public transit information with batch and streaming analytics via Kafka Connect, Flink SQL.
Tech Stack
- Kafka Connect, Flink SQL
- S3, Glue Data Catalog
Data Sources
Texas and Austin Open Data Portals (I like working with geospatial data and have relied upon this portal before as well)
| Link | Note | Update Frequency |
|---|---|---|
| https://data.texas.gov/d/cuc7-ywmd | Vehicle Positions (json) - track location, speed, which trip its on, etc. | 15 seconds |
| https://data.texas.gov/d/mqtr-wwpy | Trip Updates (json) - where it is now, which stops its heading to next, etc. | 15 seconds |
| https://data.austintexas.gov/d/dx9v-zd7x | Traffic Incidents (json) - road accidents across cars, bikes, etc. | 5 minutes |
| https://data.texas.gov/d/r4v4-vz24 | Schedule data (csv) - stops, stop timings, fare structure, etc. | Static/lookup data |
The transit data follow the GTFS specification (like OpenAPI specification for transit data, created by Google).
I have ingested the JSON data, but they also provide it in Protobuf (schema here).
Sample Data:
-
Vehicle Positions
[ { "id": "2551", "vehicle": { "trip": { "tripId": "2881421_9450", "startTime": "10:50:00", "startDate": "20250725", "scheduleRelationship": "SCHEDULED", "routeId": "337", "directionId": 0 }, "position": { "latitude": 30.335175, "longitude": -97.74187, "bearing": 275.1, "speed": 15.42288 }, "currentStopSequence": 41, "currentStatus": "STOPPED_AT", "timestamp": "1753461474", "stopId": "5720", "vehicle": { "id": "2551", "label": "2551" } } }, { "id": "2304", "vehicle": { "trip": { "tripId": "2884786_12378", "startTime": "11:28:00", "startDate": "20250725", "scheduleRelationship": "SCHEDULED", "routeId": "642", "directionId": 0 }, "position": { "latitude": 30.29201, "longitude": -97.74099, "speed": 0.0 }, "currentStopSequence": 5, "currentStatus": "IN_TRANSIT_TO", "timestamp": "1753461474", "stopId": "5373", "vehicle": { "id": "2304", "label": "2304" } } }, ... ] -
Trip Updates
{ "id": "2878426_4692_2814_27900", "tripUpdate": { "trip": { "tripId": "2878426_4692", "startTime": "07:45:00", "startDate": "20250725", "scheduleRelationship": "SCHEDULED", "routeId": "30", "directionId": 1 }, "stopTimeUpdate": [ { "stopSequence": 49, "departure": { "time": "1753454712" }, "stopId": "2738", "scheduleRelationship": "SCHEDULED" }, { "stopSequence": 50, "arrival": { "time": "1753454753" }, "stopId": "5950", "scheduleRelationship": "SCHEDULED" }, ... ], "vehicle": { "id": "2814" }, "timestamp": "1753454712" } } -
Traffic Incidents
[{ "traffic_report_id": "2192F9498F37E8D5F2BBA41585B5C7ED4D0DB457_1561069960", "published_date": "2019-06-20T22:32:40.000Z", "issue_reported": "COLLISION", "location": { "type": "Point", "coordinates": [ -98.024524, 30.3315 ] }, "latitude": "30.3315", "longitude": "-98.024524", "address": "W Sh 71 & Bee Creek Rd", "traffic_report_status": "ARCHIVED", "traffic_report_status_date_time": "2019-06-20T22:55:03.000Z", ":@computed_region_pgdr_vyqg": "78", ":@computed_region_99rk_ypn4": "170", ":@computed_region_g44y_bfnm": "6", ":@computed_region_m2th_e4b7": "496", ":@computed_region_rxpj_nzrk": "73" }, ...] -
Schedule Data
-
Stops
stop_id,at_street,corner_placement,heading,location_type,on_street,parent_station,stop_code,stop_desc,stop_lat,stop_lon,stop_name,stop_position,stop_timezone,stop_url,wheelchair_boarding,zone_id 1002,Burton,SW,144,0,Riverside,,1002,002021 Riverside & Burton,30.240341,-97.727308,Riverside/Burton,N,,https://www.capmetro.org/stopdetail/index.php?stop=1002,0, 1003,Willow Creek,NW,162,0,Riverside,,1003,002237 Riverside & Willow Creek,30.238275,-97.726015,2237 Riverside/Willow Creek,M,,https://www.capmetro.org/stopdetail/index.php?stop=1003,0, ... -
Stop Times
trip_id,arrival_time,departure_time,stop_id,stop_sequence,pickup_type,drop_off_type,shape_dist_traveled,timepoint 2874994_0001,04:44:00,04:44:00,554,1,0,0,0.0000,1 2874994_0001,04:45:31,04:45:31,555,2,0,0,0.4252,0 -
Fare attributes
fare_id,price,currency_type,payment_method,transfers,transfer_duration b,3.50,USD,0,0, a,1.25,USD,0,0 -
Transfers
from_stop_id,to_stop_id,transfer_type,min_transfer_time 1002,1003,2,300 1002,1030,2,300 1002,1032,2,300 -
Routes
route_id,agency_id,route_short_name,route_long_name,route_type,route_url,route_color,route_text_color
1,CM,1,1-North Lamar/South Congress,3,http://www.capmetro.org/current_schedules/pdf/001.pdf,004A97,FFFFFF
10,CM,10,10-South 1st/Red River,3,http://www.capmetro.org/current_schedules/pdf/010.pdf,004A97,FFFFFF
-
Ingesting data into Kafka
For ingesting data, I have used Kafka Connect’s connectors
| Topic(s) | Connector | Ingestion Frequency |
|---|---|---|
vehiclePositions , tripUpdates | HTTP Source | 1 minute |
trafficIncidents | HTTP Source | 5 minutes |
stops , fare_attributes , ,transfers, routes , stop_times | S3 Source | - |
-
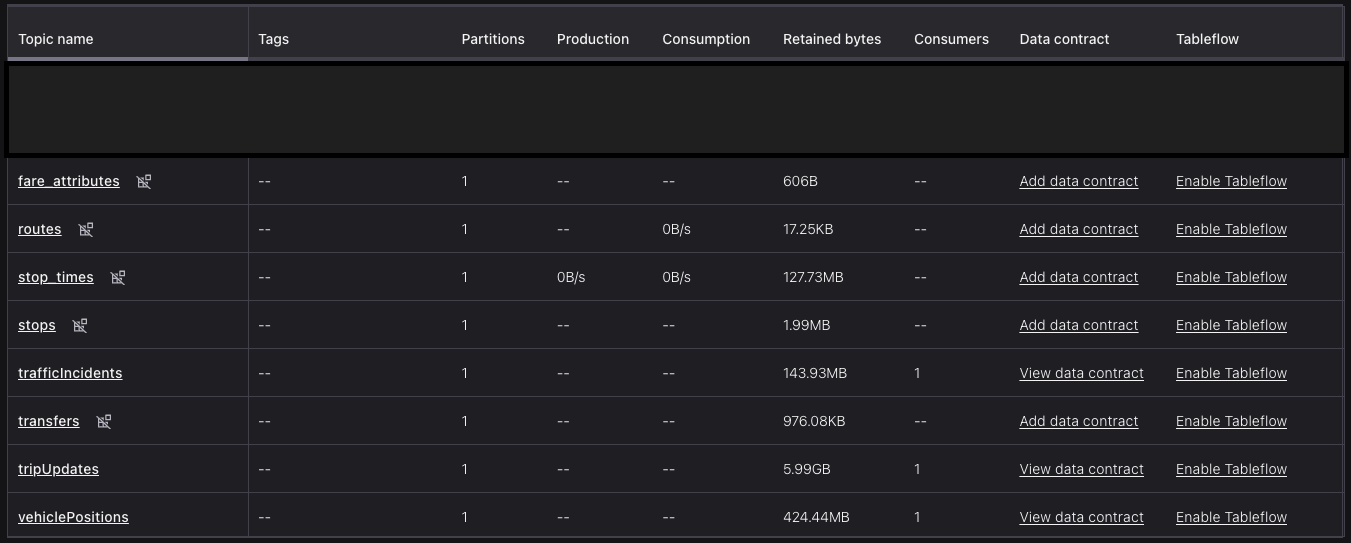
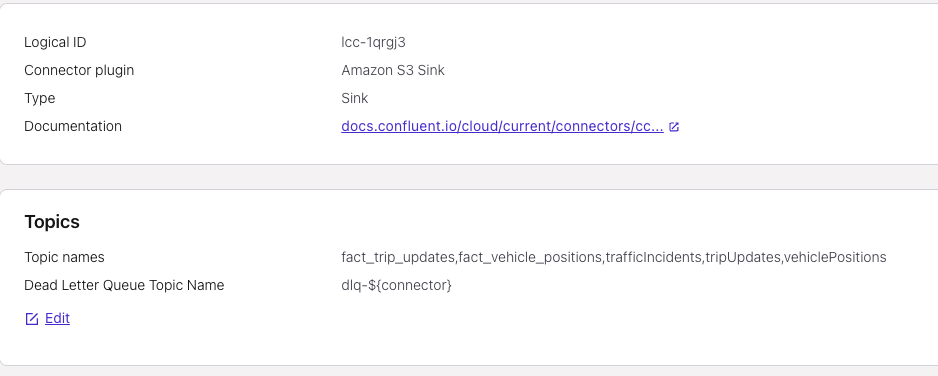
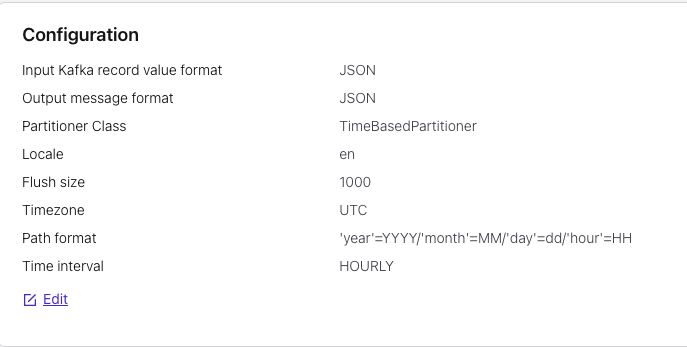
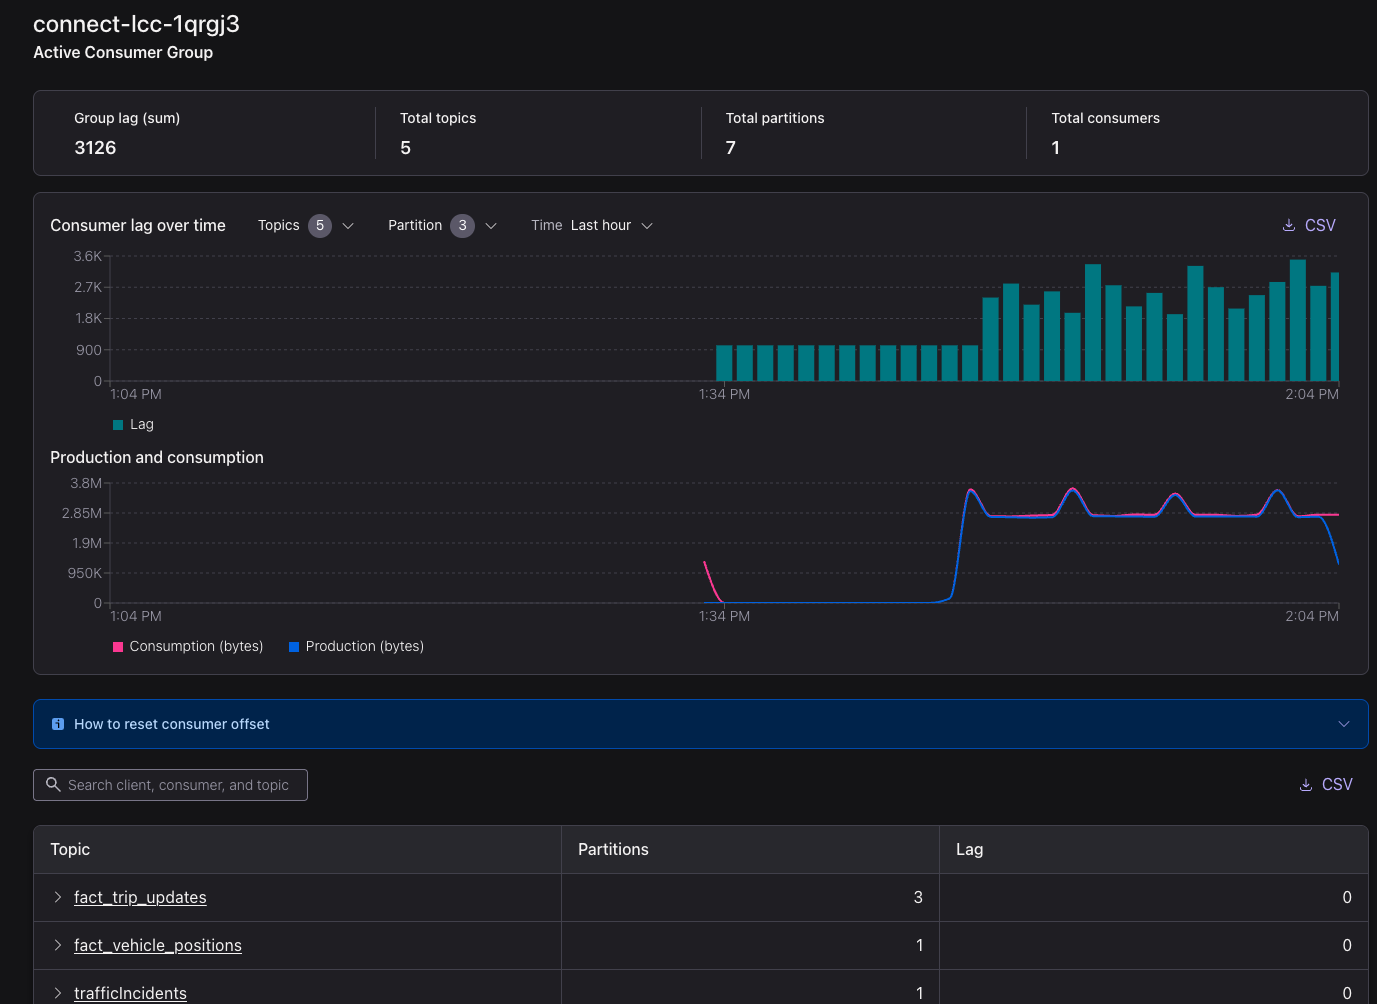
Screenshots
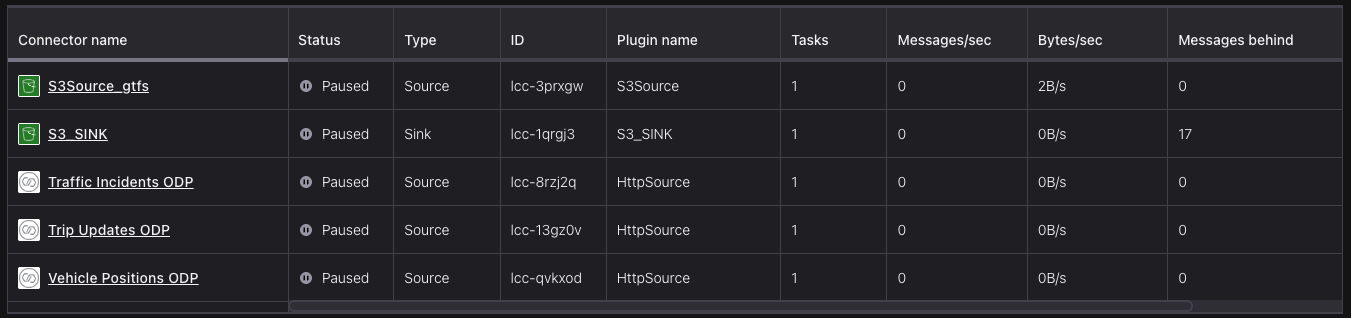
Ingestion connectors
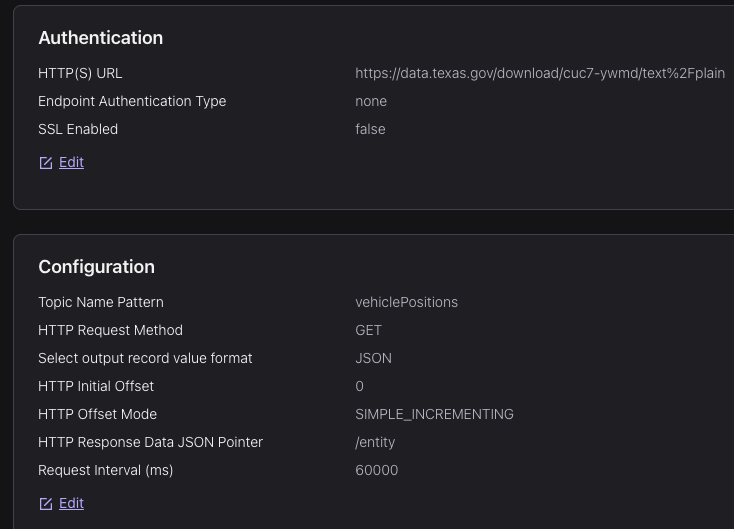
Configurations (others were kept as default)
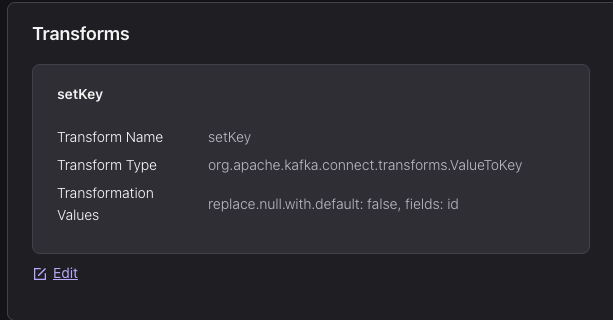
SMT function to set vehicle
idfield as topic’s KeyThese were from vehicle position data source, which were (managed) HTTP Source connectors. Similar setup for trip updates and traffic incidents data
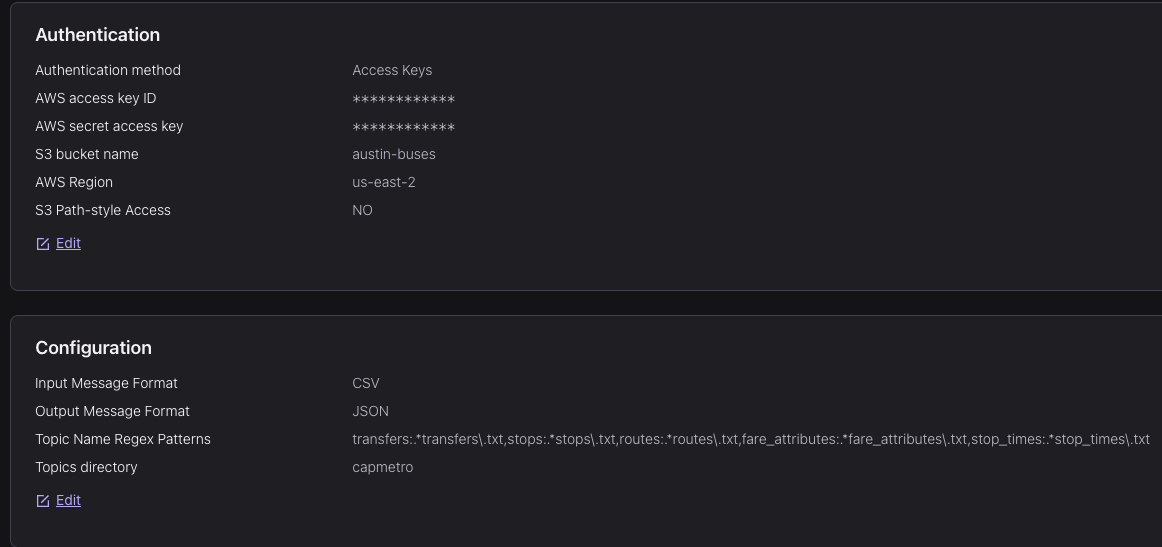
Confluent auto-creates these topics This is from S3 Source connector for the schedule data
After ingesting the data, I used Gemini to create the data contracts (JSON Schema), and then applied it to the topics (except schedule data).
partition=1 to save $$
Streaming Analytics via Flink
For stream transformations and analytics, I have used Flink SQL:
Transformations:
The GTFS-Realtime data has multiple nested levels (of type ROW in Flink) so to make our life easier and store only relevant factual information (without metadata), we flatten (unnest) the data and retrieve only specific columns.
Generating fact tables from vehiclePositions and tripUpdates
CREATE TABLE fact_trip_updates (WATERMARK FOR event_time AS event_time - INTERVAL '5' SECOND) DISTRIBUTED BY (id) INTO 3 BUCKETS
 WITH ('changelog.mode' = 'append', 'kafka.cleanup-policy' = 'delete', 'kafka.retention.time' = '1 day', 'scan.startup.mode'='latest-offset',
  'key.format' = 'json-registry', 'value.format' = 'json-registry'
) AS
SELECT
    t.id,
    -- Unpack fields from the top-level 'tripUpdate' ROW
    t.tripUpdate.trip.tripId,
    t.tripUpdate.trip.routeId,
    t.tripUpdate.vehicle.id AS vehicleId,
    -- Unpack fields from the unnested 'stop_update' ROW
    stop_update.stopSequence,
    stop_update.stopId,
    stop_update.arrival.`time` AS arrival_time,
    stop_update.departure.`time` AS departure_time,
    -- Carry over the Flink event time for each new row
    t.`$rowtime` AS event_time
FROM
    tripUpdates AS t,
    -- Use UNNEST to expand the stopTimeUpdate array into individual rows
    UNNEST(t.tripUpdate.stopTimeUpdate) AS stop_update;

  CREATE TABLE fact_vehicle_positions (WATERMARK FOR event_time AS event_time - INTERVAL '5' SECOND) DISTRIBUTED BY (id) INTO 1 BUCKETS
 WITH ('changelog.mode' = 'append', 'kafka.cleanup-policy' = 'delete', 'kafka.retention.time' = '1 day', 'scan.startup.mode'='latest-offset',
  'key.format' = 'json-registry', 'value.format' = 'json-registry'
) AS
SELECT
    id,
    -- Unpack fields from the nested 'vehicle' ROW
    vehicle.trip.tripId,
    vehicle.trip.routeId,
    `vehicle`.`position`.`latitude`,
    `vehicle`.`position`.`longitude`,
    `vehicle`.`position`.`speed`,
    vehicle.currentStatus,
    vehicle.stopId,
    `vehicle`.`timestamp` AS vehicle_timestamp,
  $rowtime AS event_time
FROM
    vehiclePositions;
Analytics:
-
Average speed and number of Vehicles per Route (Last 10 Minutes)
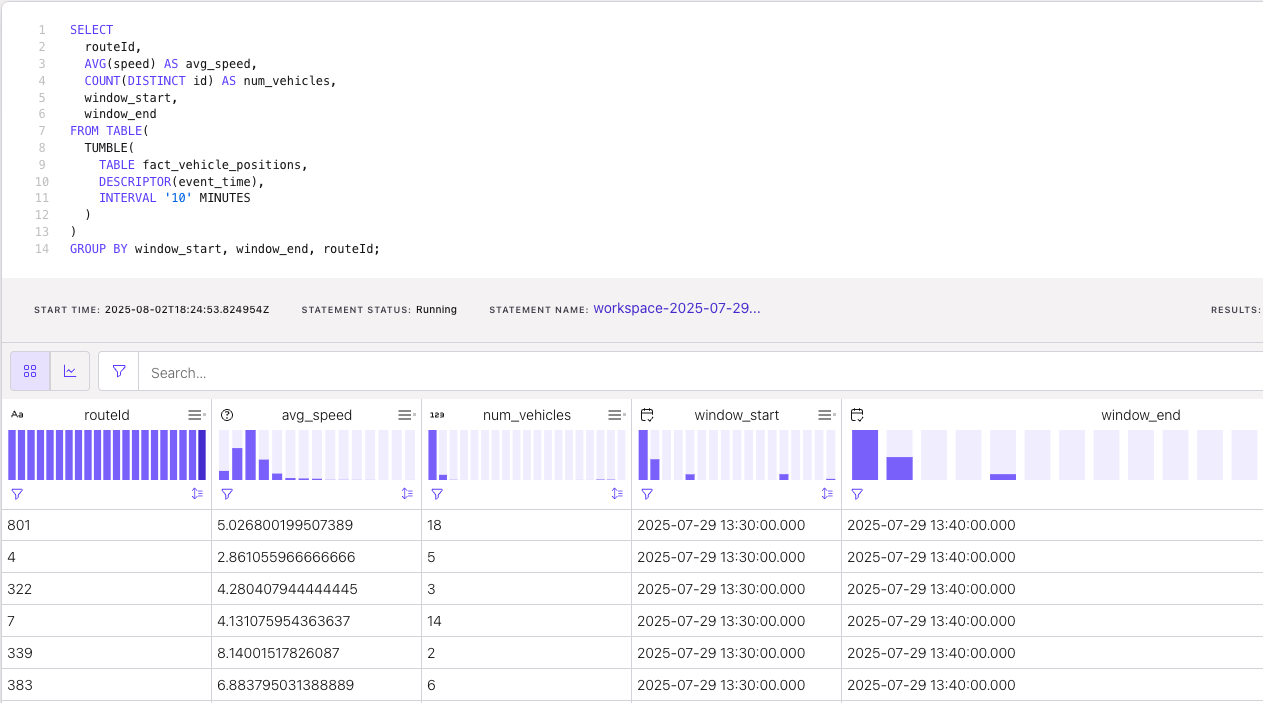
-
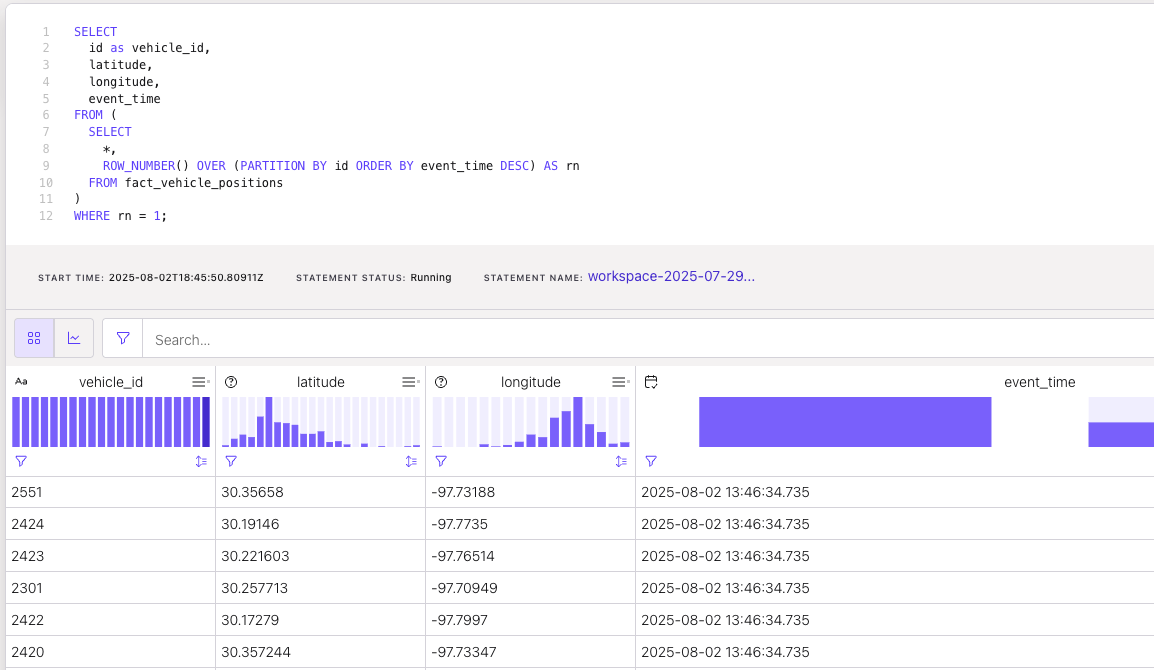
Current location of each vehicle
-
Forgot to take more screenshots (and my $25 Confluent credits got over ☠️ for me to retry). But did some more analysis on average delays in past hour, routes with most delays, ETA for each stop with updated times, checking stops with delays have traffic accidents nearby (using geospatial UDF with haversine distance).
Loading data into S3
For loading raw data (real-time & derived data) into S3, I used the S3 Sink connector.
Then I used Glue Data Catalog to store table metadata.
-
Screenshots
S3 sink connector
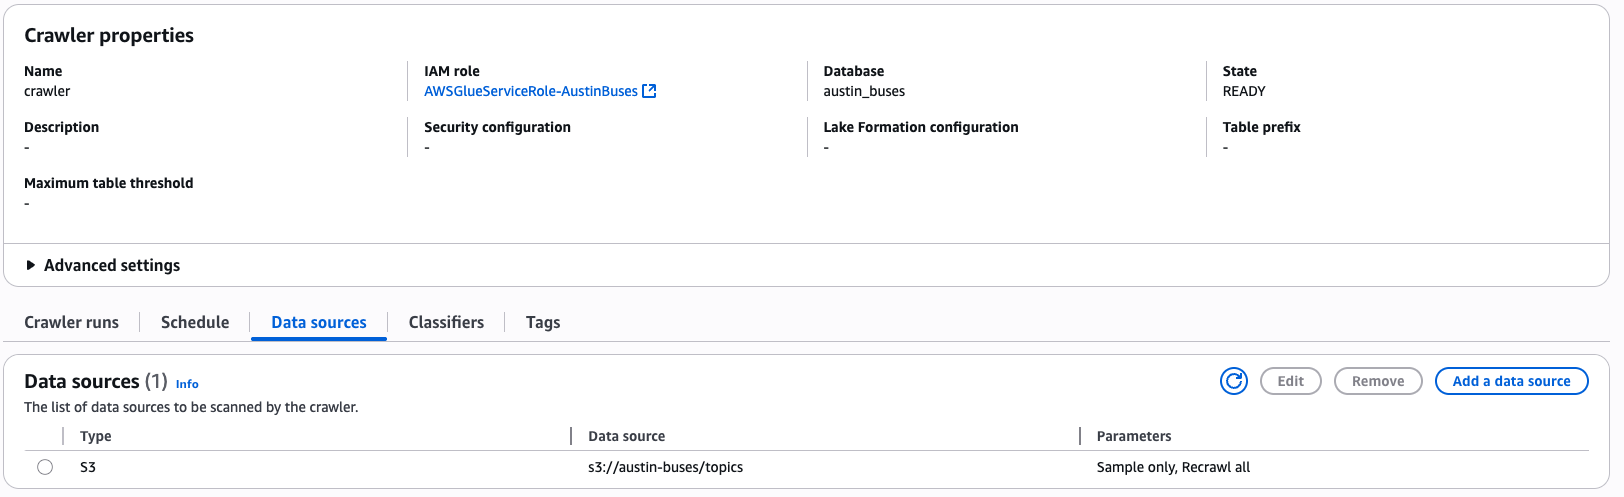

some tables in Glue Data Catalog
Batch Analytics with Athena
With all data stored in S3, we can use Athena (or Redshift Serverless) to run some batch/ad-hoc analytics. Due to some limitations on free account plan, I can’t do this.
I have already exhausted my QuickSights free 30 days, so I am not able to use that too. I was planning to use it for time-series and map visualizations.
Takeaways
- Good understanding of Kafka Connect, Flink SQL
- In general streaming use cases are expensive but Confluent Cloud has a weird pricing model
- Wish there was a way to write UDFs in Flink using SQL rather than just Java or Python
- Using managed services made my life much easier (no need to manage Kafka or Flink clusters)
Extending this system
-
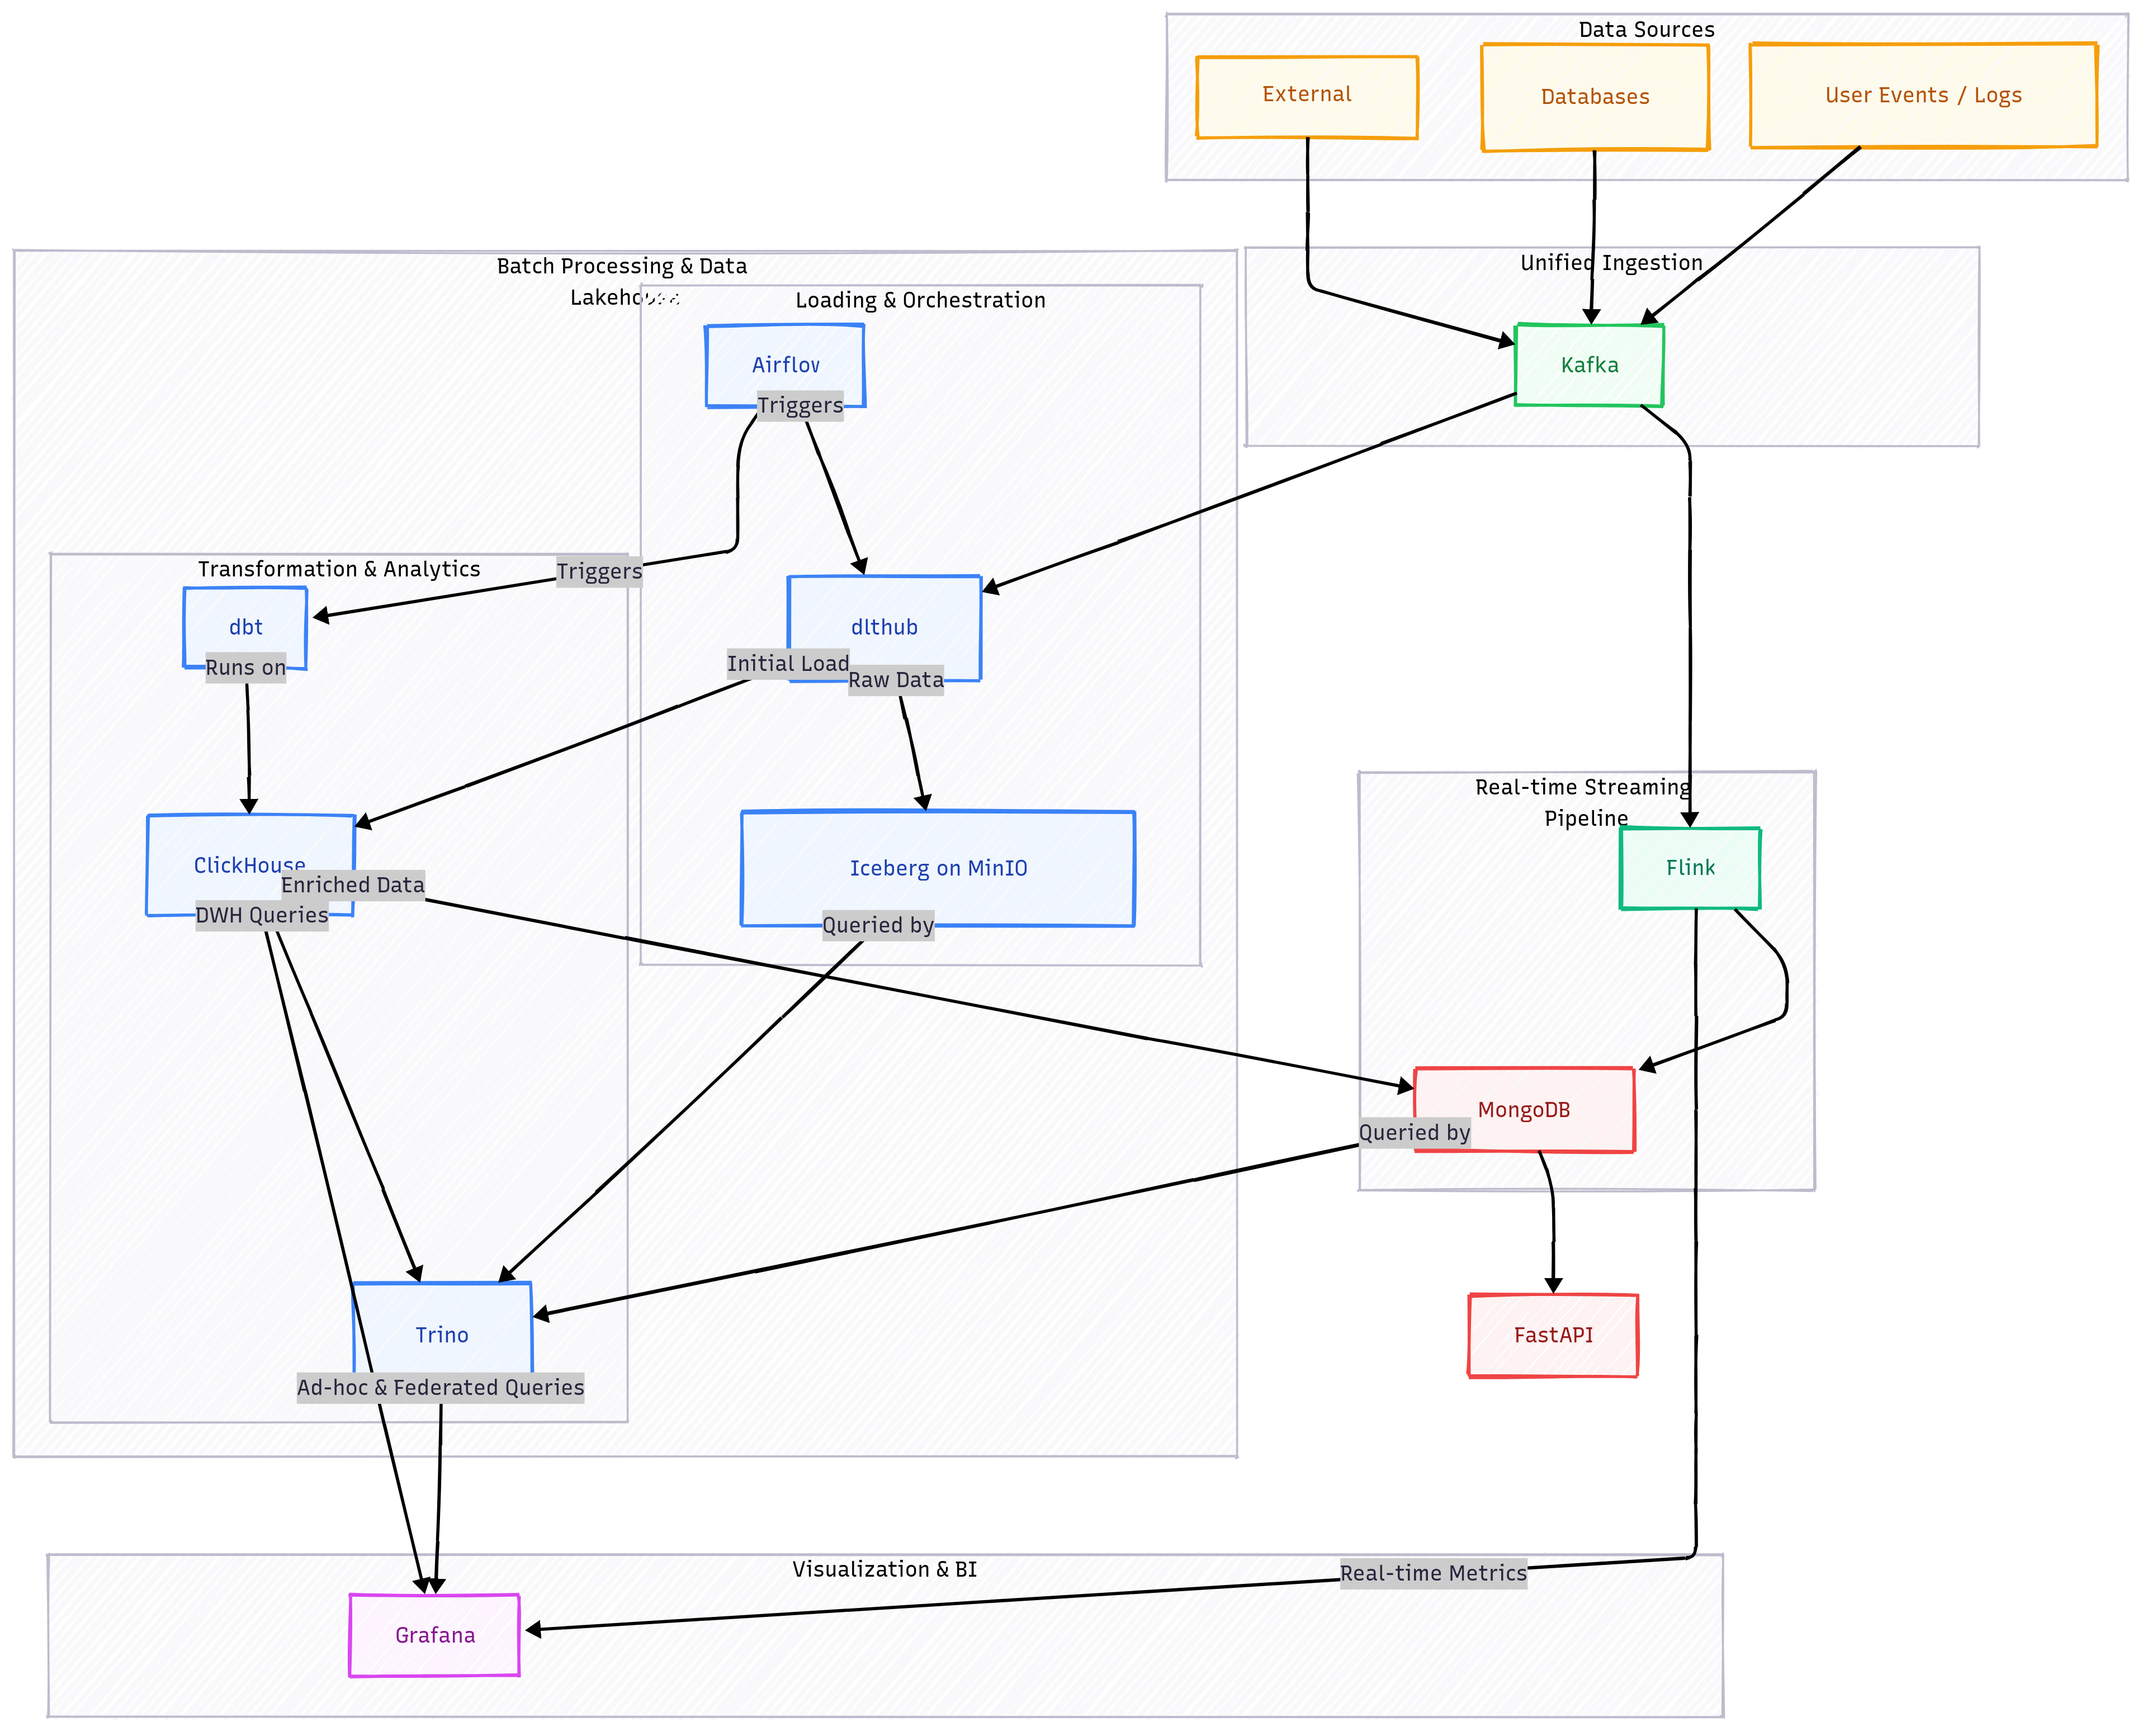
Cloud Services
![Cloud providers - AWS [Redshift, DocumentDB, Airflow, S3, Lambda, EC2], Confluent [Kafka, Flink]. Replace dlthub with Kafka Connect.](/images/de-project-1.png)
Cloud providers - AWS [Redshift, DocumentDB, Airflow, S3, Lambda, EC2], Confluent [Kafka, Flink]. Replace
dlthubwith Kafka Connect. -
Open-Source